ch: 2 図
2.1 図
- 図の名前の指定
(ref:irisplot) 図のタイトル
plot(iris$Sepal.Length, iris$Petal.Length)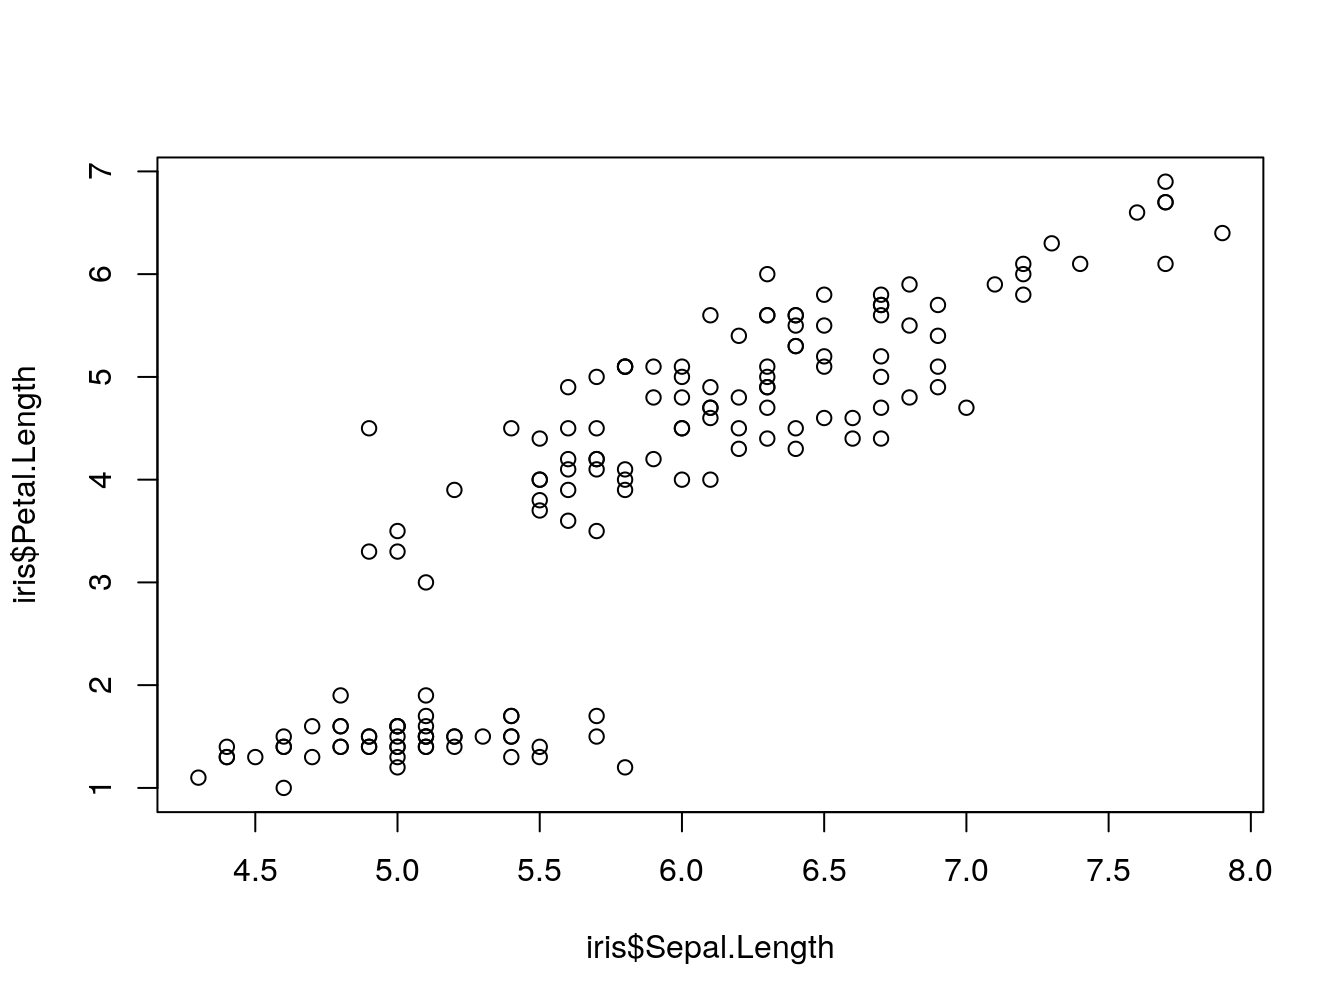
Figure 2.1: 図のタイトル
library(tidyverse)ggplot(iris) +
geom_point(aes(Sepal.Length, Petal.Length, color = Species))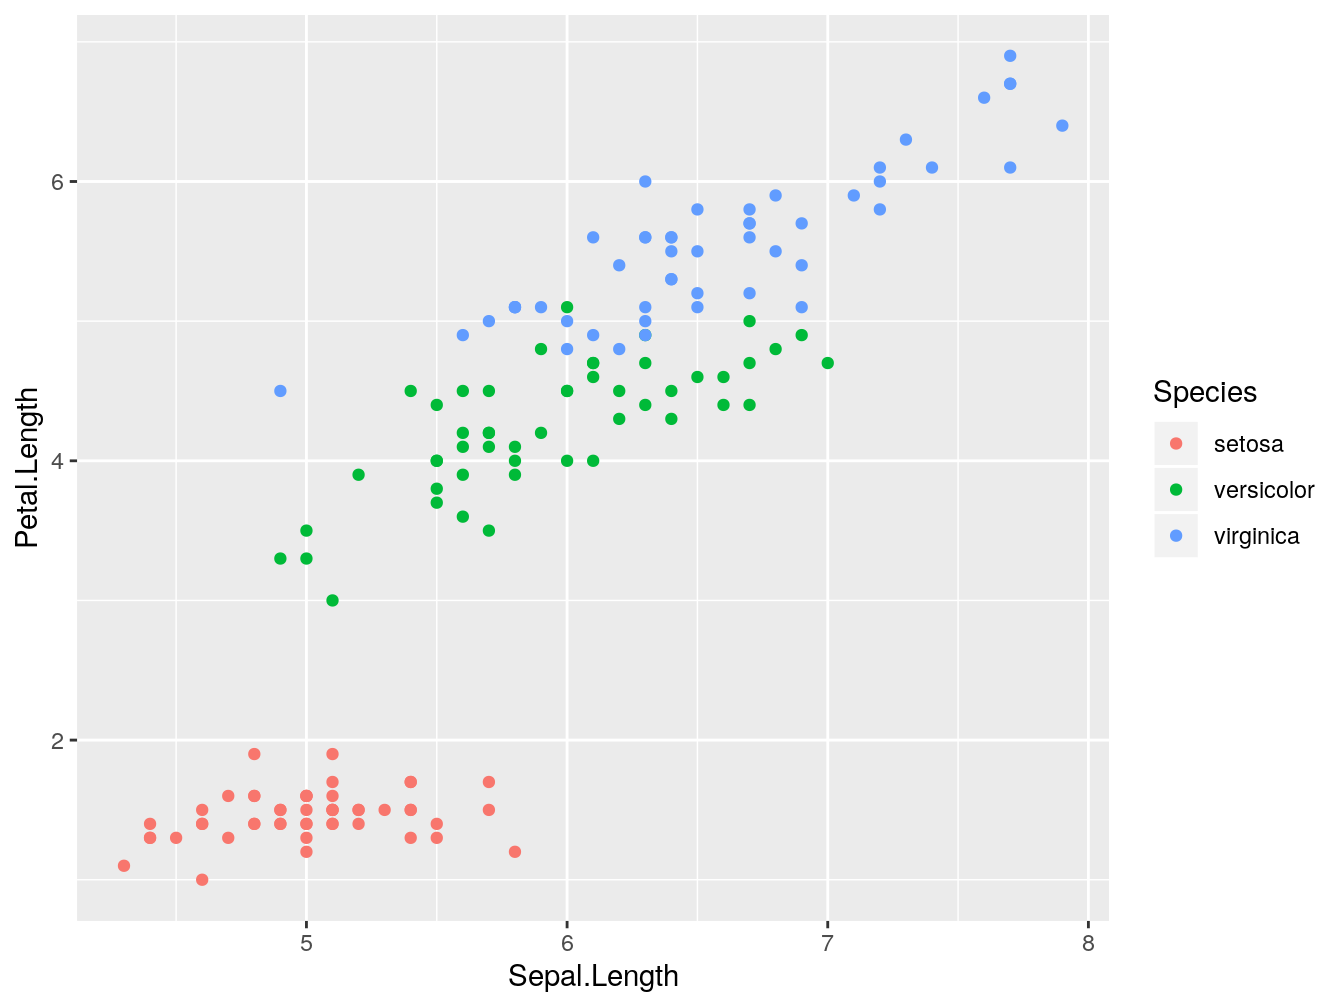
Figure 2.2: ggplot
図が出ない(T_T)
2.2 表
knitr::kable(
  head(mtcars[, 1:3], 5), booktabs = TRUE,
  caption = 'mtcarsデータの最初の5行の表'
)| mpg | cyl | disp | |
|---|---|---|---|
| Mazda RX4 | 21.0 | 6 | 160 |
| Mazda RX4 Wag | 21.0 | 6 | 160 |
| Datsun 710 | 22.8 | 4 | 108 |
| Hornet 4 Drive | 21.4 | 6 | 258 |
| Hornet Sportabout | 18.7 | 8 | 360 |